
How Workflow OS decides which process to automate first
One number from 0 to 100 per process. Here is every weight behind it, taken from the scoring engine, and one process worked through by hand.

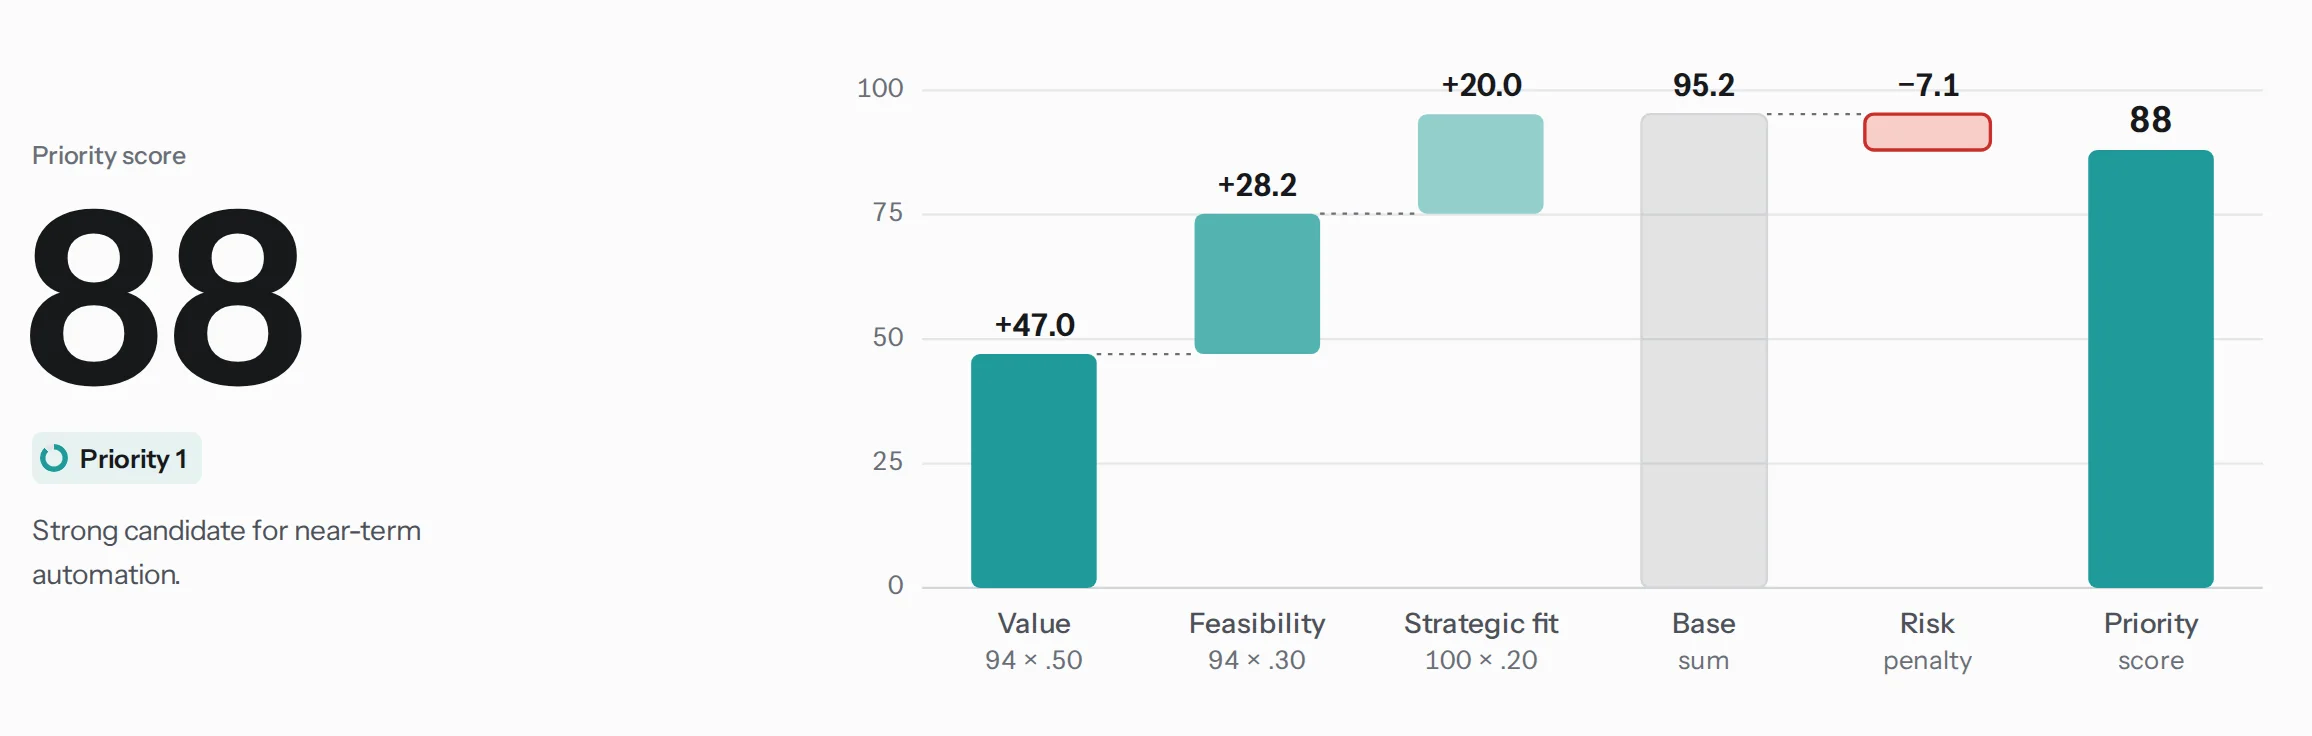
Workflow OS gives every process one priority score from 0 to 100, and the process with the highest score goes first. The score blends value, feasibility and strategic fit from fourteen weighted factors, then takes off a risk penalty of up to 25 points. This article shows every weight, copied from the scoring engine, and computes one process by hand.
Whatever tool does the scoring, five questions decide the order:
- How many staff hours a month does the process take?
- How often is the work redone because of an error?
- Are the steps standard and the rules written down?
- Are the data clean, and can the systems it touches be reached by an integration?
- What does an automated mistake cost: a privacy breach, a regulatory finding, a wrong letter to a client?
The engine is deterministic. The same inputs always give the same score, and every number on screen shows the factors and evidence behind it. A language model can help collect the inputs during discovery. It plays no part in the arithmetic.
The worked numbers come from the Workflow OS demo: Northstar Professional Services, a fictional 30-person firm with 17 mapped processes. Every figure below is engine output.
The formula
Fourteen factors are grouped into value, feasibility and strategic fit. Each group gets a score from 0 to 100. The three scores are blended, and a risk penalty of up to 25 points comes off the top.
Priority score
- Base score
- Value × 0.50 + Feasibility × 0.30 + Strategic fit × 0.20
- Risk penalty
- privacy (≤ 8) + regulatory (≤ 6) + consequence (≤ 6) + change (≤ 5), at most 25
- Priority
- round(Base − Risk penalty), kept between 0 and 100
Value carries half the weight on purpose. A process that frees no measurable staff time rarely pays for its automation, however easy it is to build. Feasibility comes second because a valuable process on scattered data still needs a clean-up project first.
Fourteen factors in three groups
Inside each group the factors have their own weights. Multiply a factor’s weight in its group by the group weight and you get its share of the base score.
| Factor | In group | In base | |
|---|---|---|---|
| Value (50% of the base) | |||
| Labour / time consumed | 30% | 15% | |
| Transaction volume | 20% | 10% | |
| Error / rework impact | 15% | 7.5% | |
| Cycle-time impact | 15% | 7.5% | |
| Customer / revenue impact | 20% | 10% | |
| Feasibility (30% of the base) | |||
| Process standardization | 25% | 7.5% | |
| Data readiness | 25% | 7.5% | |
| System / integration readiness | 20% | 6% | |
| Rule clarity | 15% | 4.5% | |
| Exception predictability | 15% | 4.5% | |
| Strategic fit (20% of the base) | |||
| Repeatability | 35% | 7% | |
| Scalability | 25% | 5% | |
| Employee pain | 20% | 4% | |
| Management priority | 20% | 4% | |
Labour is the heaviest single factor at 15% of the base, followed by transaction volume and customer impact at 10% each. Five of the fourteen factors are measured quantities. The other nine are ratings on a five-point rubric, with a written description for 1, 3 and 5 on every factor.
From hours and cases to points
Measured inputs become points through fixed breakpoints, with straight lines between them. The scales are calibrated for firms of 10 to 200 people. A process that takes 100 staff hours a month, about 0.6 of a full-time person, earns full labour points.
| Input | Breakpoint: points |
|---|---|
| Staff hours a month | 0: 0 5: 15 20: 45 50: 75 100: 100 |
| Cases a month | 0: 0 10: 35 25: 60 50: 85 100: 95 250: 100 |
| Share of cases reworked | 0%: 0 2%: 20 5%: 45 10%: 75 15%: 90 25%: 100 |
| Waiting hours per case | 0: 0 4: 20 24: 50 72: 80 168: 100 |
| Rubric rating | 1: 0 2: 25 3: 50 4: 75 5: 100 |
| System readiness | average over the process’s systems: full API 100, partial 60, unknown 40, none 10 |
The rubric anchors are written for each factor. Data readiness, for example, runs from 1, “scattered in inboxes and files”, through 3, “mostly in systems, some cleaning”, to 5, "structured, in systems, accessible".
The risk penalty
Four kinds of risk subtract points: privacy, regulatory exposure, the consequence of a wrong autonomous action, and how much the change disrupts the organization. Each has its own cap, and together they can remove at most 25 points.
| Risk | Mapping | Cap |
|---|---|---|
| Privacy / data sensitivity | public 0 · internal 1 · confidential 3 · restricted 8 | 8 |
| Regulatory exposure | 1: 0 2: 0.9 3: 2.4 4: 4.2 5: 6 | 6 |
| Consequence of a wrong action | 1: 0 2: 0.9 3: 2.4 4: 4.2 5: 6 | 6 |
| Change complexity | 1: 0 2: 0.75 3: 2 4: 3.5 5: 5 | 5 |
The convex shares make risk escalate at the top of the scale: a 4 costs almost twice a 3. In the demo, KYC / Compliance Intake shows the effect. Its value score is 62, a respectable number. Restricted data, regulated decisions and a severe consequence of error cost it 22 points, and it lands at 40, in the Low / later band. That process still gets a design. It gets a human-in-the-loop design, where AI prepares the file and a qualified person makes every decision (see how the pattern is chosen).
Client Onboarding, worked through
Client Onboarding tops the demo ranking. Sixty new clients a month, 100 minutes of staff time each, about five days of waiting per case and 14% of cases reworked. Here is every factor as the engine scores it.
Client Onboarding, factor by factor
- Labour / time consumed 100 h a month 100 × 0.30 30
- Transaction volume 60 cases a month 87 × 0.20 17.4
- Error / rework impact 14% reworked 87 × 0.15 13.05
- Cycle-time impact 120 h waiting 90 × 0.15 13.5
- Customer / revenue impact 5 / 5 100 × 0.20 20
- Process standardization 5 / 5 100 × 0.25 25
- Data readiness 5 / 5 100 × 0.25 25
- System / integration readiness 4 of 6 systems with full API 86.7 × 0.20 17.34
- Rule clarity 5 / 5 100 × 0.15 15
- Exception predictability 4 / 5 75 × 0.15 11.25
- Repeatability 5 / 5 100 × 0.35 35
- Scalability 5 / 5 100 × 0.25 25
- Employee pain 5 / 5 100 × 0.20 20
- Management priority 5 / 5 100 × 0.20 20
- Privacy / data sensitivity Confidential cap 8 −3
- Regulatory / compliance exposure 3 / 5 (KYC / compliance review) cap 6 −2.4
- Consequence of a wrong autonomous action 2 / 5 cap 6 −0.9
- Organizational / change complexity 2 / 5 (4 roles, 6 systems) cap 5 −0.8
Client Onboarding
- Base score
- 94 × 0.50 + 94 × 0.30 + 100 × 0.20 = 47.0 + 28.2 + 20.0 = 95.2
- Risk penalty
- 3 + 2.4 + 0.9 + 0.8 = 7.1
- Priority
- round(95.2 − 7.1) = round(88.1) = 88
Labour, volume and customer impact are close to full points, so the value score rests on measured inputs. The penalty stays small because only one step, the KYC review, carries regulated judgement. The design keeps that step with a person, which is the subject of the Client Onboarding walkthrough.
Bands, quadrants and the no-volume cap
The priority score sorts processes into four bands. Each band says what to do next.
| Priority | Band | Meaning | Demo |
|---|---|---|---|
| 80–100 | Priority 1 | Strong candidate for near-term automation. | 3 |
| 65–79 | High opportunity | Worth designing after validating assumptions. | 4 |
| 50–64 | Medium | Potential value; important dependencies exist. | 6 |
| 0–49 | Low / later | Hold until value or readiness improves. | 4 |
A second view plots value against feasibility, with the line at 60 on both axes. High on both is “Do first”. High value on hard ground is a “Strategic project”. Easy but modest is a “Quick win”. Low on both is “Avoid”. In the demo, Contract Review Intake has value 81 and feasibility 51, because its rules rely on legal judgement: a strategic project, ranked sixth.
One guard sits on top of everything. A process with no recurring volume, or no staff hours, is capped at 49, whatever its ratings say. A process that happens twice a year has nothing to automate at scale.
Confidence travels with the score
Every input carries its source: provided by the client, imported, calculated, or estimated by a person or a model. Confidence is the share of the base-score weight that rests on confirmed inputs. At 70% and above it is High, from 40% Medium, below that Low.
Client Onboarding sits at 66%, so its confidence is Medium. Four inputs are still estimates: the loaded hourly cost of $60, the 14% rework rate, the 120 hours of waiting and the exception rating. The engine lists each one with the action that confirms it, most influential first: “Loaded hourly cost ($60/h) is an estimate; confirm it with finance.” Confirming the cost alone lifts confidence to High.
What the score is for
The score ranks a queue. Money comes later, once a design exists and the minutes it removes can be counted. The two can disagree. In the same demo company, Expense Processing scores 57, in the Medium band, and its generated design shows a Year-1 ROI of −35.2% with payback after 21.5 months. The ranking said “maybe”. The business case said “later”.
The weights are expert-set defaults chosen for small and mid-sized firms, and they are visible on the Method page of the product. They have yet to be fitted statistically. Each pilot records actual minutes, volume and ROI next to the projection, and the weights and breakpoints get recalibrated as those actuals accumulate.
To see the score on screen, with the waterfall and the evidence behind each factor, open the Workflow OS page. To read how the score turns into a design and a payback period, continue with Client Onboarding, from process map to payback. The wider method, from discovery to measured results, is on AI transformation. If you want your own processes scored, ask for a Workflow OS session.
